


 Email this Article
 Print
Print Download (PDF)
Abstract 
This study deals with the differential response of Lantana camara L. (lantana) cover on the forest structure, regeneration and expected future compositional change of tree species in the Vindhyan dry deciduous tropical forest of India. A total of 90 quadrats, distributed over three sites, differing in lantana cover (low; 0-30%, medium; 31-60% and high; 61-100%), were used to enumerate the tree species. A total of 37 species with 14851 stems were enumerated from the three study sites, which were in gradient of lantana cover. Number of species varied from 21 to 30, while the number of individuals varied from 3408 to 7458 per site with former in high and later in low lantana cover. PCA ordination and Bray-Curtis cluster analysis revealed that the sites were not very unique with tree composition but showed marked uniqueness of sites in terms of seedling composition. The distinctness of species composition in the seedling stage is indicative of marked temporal dynamics, of this lantana invaded forest. The site wise regeneration analysis with the relative density of tree species at each life cycle stage (adult, sapling and seedling) showed that regeneration of species is poor at high-invaded site. The least invaded site indicated good regeneration with many new species emerging. Such differential change in vegetation composition at different lantana cover may be attributed to changed light and fire regime and also due to increased allelopathic suppression of tree seedlings. In conclusion lantana cover is suppressing regeneration and reducing availability of forest resources, which is of serious human concern.
Key
words: Bray-Curtis analysis, future forest composition change,
Lantana camara cover, PCA ordination and
regeneration
Introduction
Invasive alien plants have become a serious threat to plant biodiversity in many parts of the world (Mack et al. 2000). These invasive species form very dense population, which affect the population dynamics of the persisting species (Mack et al. 2000). Land-use changes such as the replacement of natural ecosystems by agricultural systems clearly alter many ecosystem functions and may promote biological invasions (Hobbs, 2000). In India, tropical forests account for approximately 86% of the total forest land (Singh & Singh, 1988) and dry forests account for 38.2% of the total forest cover (MoEF, 1999). These forests are under immense pressure due to various human induced activities. The human population of the Sonebhadra district in the Vindhyan region increased from 683249 in 1981 to 930993 in 1991 and 1463468 in 2001 (about 36.25% increase in previous 10 years and 57.20% increase in later 10 years) (Rajya Niyojan Sansthan, 2000; Anonymous, 2003). These forests are also exposed to illegal sporadic tree felling, wide spread lopping of trees for timber resources and shrubs for fuel wood and leaf for fodder (Singh & Singh, 1989; Jha & Singh, 1990). This rapid modification of the habitat facilitated the invasion of Lantana camara (lantana) at an accelerated rate, which can affect species regeneration and subsequently leading to future compositional change of the forest. Although lantana may potentially have a devastating impact on the community structure and dynamics of forest ecosystems throughout the tropical world, there are very few studies that focus on how the cover of this species are actually affecting the tree species regeneration and future composition of the forest
Materials and Methods
Study area
The
study area lies on the Vindhyan plateau in the Sonebhadra district of
Uttar Pradesh (24º 13' to 24º19' N; 83º59' to 83º13')
(Fig 1). The elevation above the mean sea level ranges between 315
and 485 m (Singh & Singh 1992). This area has been known as
"Sonaghati" (golden valley) due to richness of its natural
resources (Singh et al. 2002).
The climate is tropical with three seasons in a year, i.e. summer (March-mid June), rainy (mid June to September) and winter (October to February). October and March constitute the transition months between the rainy and winter seasons, and between winter and summer seasons, respectively. The average rainfall varies between 850 and 1300 mm. About 85% of the annual rainfall occurs during the rainy season from the southwest monsoon. The maximum monthly temperature varies between 20ºC in January to 46ºC in June, and the mean minimum monthly temperature between 12ºC in January to 31ºC in May.
Red coloured and fine textured sandstone (Dhandraul orthoquartzite) is the most important rock of the area. Sandstone is generally underlain by shale and limestone. The soils derived from these rocks are residual ultisols and are sandy-loam in texture (Raghubanshi 1992). These soils are part of the hyperthermic formation of typical plinthustults with ustorthents according to VII approximation of the USDA soil nomenclature (Singh et al. 2002). The potential natural vegetation of the region is tropical dry deciduous forest, which is locally dominated by species such as Anogeissus latifolia, Boswellia serrata, Buchanania lanzan, Diospyros melanoxylon, Hardwickia binata, Lagerstroemia parviflora, Lannea cormendelica, Madhuca longifolia, Shorea robusta and Terminalia tomentosa.
Methods
Reconnaissance survey of the entire region was made and three sites were selected at random, these sites had visually different levels of lantana invasion. At each site 30 quadrats each 10 x 10 m in size, were sampled randomly for vegetation analysis. A total of 90 quadrats, were sampled for vegetation analysis from the entire study area.
Lantana cover was estimated in each quadrat, using the Domin Krajina scale and was transformed into percentage cover for final analysis (Mueller-Dumbois and Ellenberg 1974). Later, each site was quantified into low (0% to 30%), medium (31% to 60%) and high (61% to 100%) invasion sites on the basis of percentage cover of lantana.
The diameter of each adult individual tree 9.6 cm diameter at breast height, dbh) was measured in each quadrat. In the centre of each 10 x 10 m quadrat, a 2 x 2 m area was marked for enumeration of saplings (individuals 3.2 cm to maximum 9.6 cm dbh) and established seedlings (individuals less than 3.2 cm diameter but 30 cm height) (Sagar and Singh 2004). Seedlings shorter than 30 cm height were considered ephemeral, and the established seedlings category represented 1 to 3 yr old individuals. Stem diameter of adult and sapling individuals was measured at 1.37 m from the ground and for seedlings it was measured at 10 cm above the ground (Sagar and Singh 2004). Thus, all individuals were enumerated and measured by species. Diversity indices were calculated using the following equations:
s
H' = Σ pi ln pi (Shannon and Weaver, 1949)
i=1
In the above equations, S = number of species, pi = proportion of individuals belonging to species i, H' = Shannon-Wiener index, ln = natural log (i.e. base 2.718). The relative density of each species was calculated from number of individual species to the percentage of the total number of individuals occurring in that respective class. To interpret the future trend in species composition of the different lantana invaded forest, the presence of number individual of different species in their tree, sapling and seedling layers were enumerated. Shannon-weiner diversity indices, Bray-Curtis cluster analysis and Principal component analysis was calculated using Biodiversity Pro version 2.0 (Mc Aleece, 1997)
Statistical Analysis
Multivariate analysis
This uses an inductive, non-experimental approach to generate rather than test hypothesis. Multivariate analysis methods follow one of two strategies, either ordination (e.g. principle component analysis, factor analysis, discriminant analysis), or clustering (e.g. cluster analysis) or hybrids of these. Two methods of multivariate analysis were utilized in an effort to ascertain patterns among tree species at different life cycle stages and lantana cover, namely PCA and cluster analysis.
Principal Component Analysis
This is a method of ordination widely used in many fields, in which axis or component are successively extracted from a matrix similarities. In PCA all individuals contribute equally to the component, avoiding dominance of outliers. Mathematically, PCA involves eigen analysis of a symmetric matrix to similarities to produce a series of eigen values and there corresponding eigen vectors (Marshall and Elliot, 1998). There are as many eigen values as there are rows (or columns) in the matrix and conceptually they can be considered to measure the strength (relative length) of an axis. Each eigen value has an associated eigen vector. An eigen value gives the length of an axis; the eigen vector determines its orientation in space.
Cluster analysis
Cluster analysis is a multivariate analysis technique and is not as much a typical statistical test as it is a collection of different algorithms that put objects into clusters. The clusters formed with this family of methods should be highly internally homogeneous (member are similar to one another) and highly externally heterogeneous (members are not like members of other cluster). Unlike many other statistical procedures, cluster analysis methods are mostly used when there are no prior hypotheses, but where research is still in an explanatory phase (Backer, 1994). In essence cluster analysis finds the most significant solution possible. Group member will share certain properties in common and it is hoped that the resultant classification will provide insight into the structure of the data. A dendrogram (tree like diagram) is produced, which summarises the process of clustering. Similar cases are joined by links whose position in the diagram is determined by the level of similarity between then cases (Aldenderfer and Blashfield, 1984).
Results and Discussion
Current status of the forest
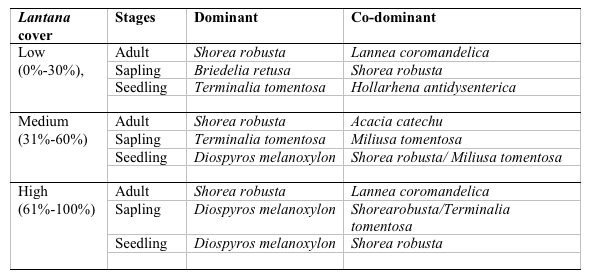
A total of 37 species with 14851 stems was recorded from the three study sites, each 0.3 ha. Number of species and number of individual varied from 21 to 30 and 3408 to 7458 per site with former in high lantana cover and later in low lantana cover (Table 1 and 2). Total diversity increased with decreasing lantana cover. Maximum 26 species and 6825 individual seedlings was at low lantana cover and minimum 17 species and 2925 individuals of seedling was reported at high lantana cover site (Table 1 and 2). The PCA ordination of the three sites on the basis of relative density (Table 2) of species in the tree (adult), sapling and seedling population is illustrated in Figure 1. The PCA axis 1 and 2 accounted for 29.38 and 22.60% variation for tree species (Fig 1a), while it accounted 17.66 and 16.32% variation for sapling species (Fig 1b). On the other the seedling species showed 44.64 and 21.34 %variation for axis 1 and 2 respectively (Fig 1c). When all the stages were taken into consideration the PCA axis 1 accounted for 21.64% variation and axis 2 accounted for 12.7% variation (Fig 1d). Table 3 show the dominant and the co-dominant species in there various life cycle stages (tree, sapling and seedling) at different level of lantana cover, with the next top three subordinate species at low lantana cover includes Acacia catechu, Buchanania lanzan and Briedelia retusa / Schrebera swietenioides. At medium lantana cover Anogeissus latifolia, Lagerstroemia parviflora and Terminalia tomentosa form the subordinate species. And at high lantana cover Madhuca longifolia, Terminalia tomentosa and Adina cordifolia form the major subordinate species.
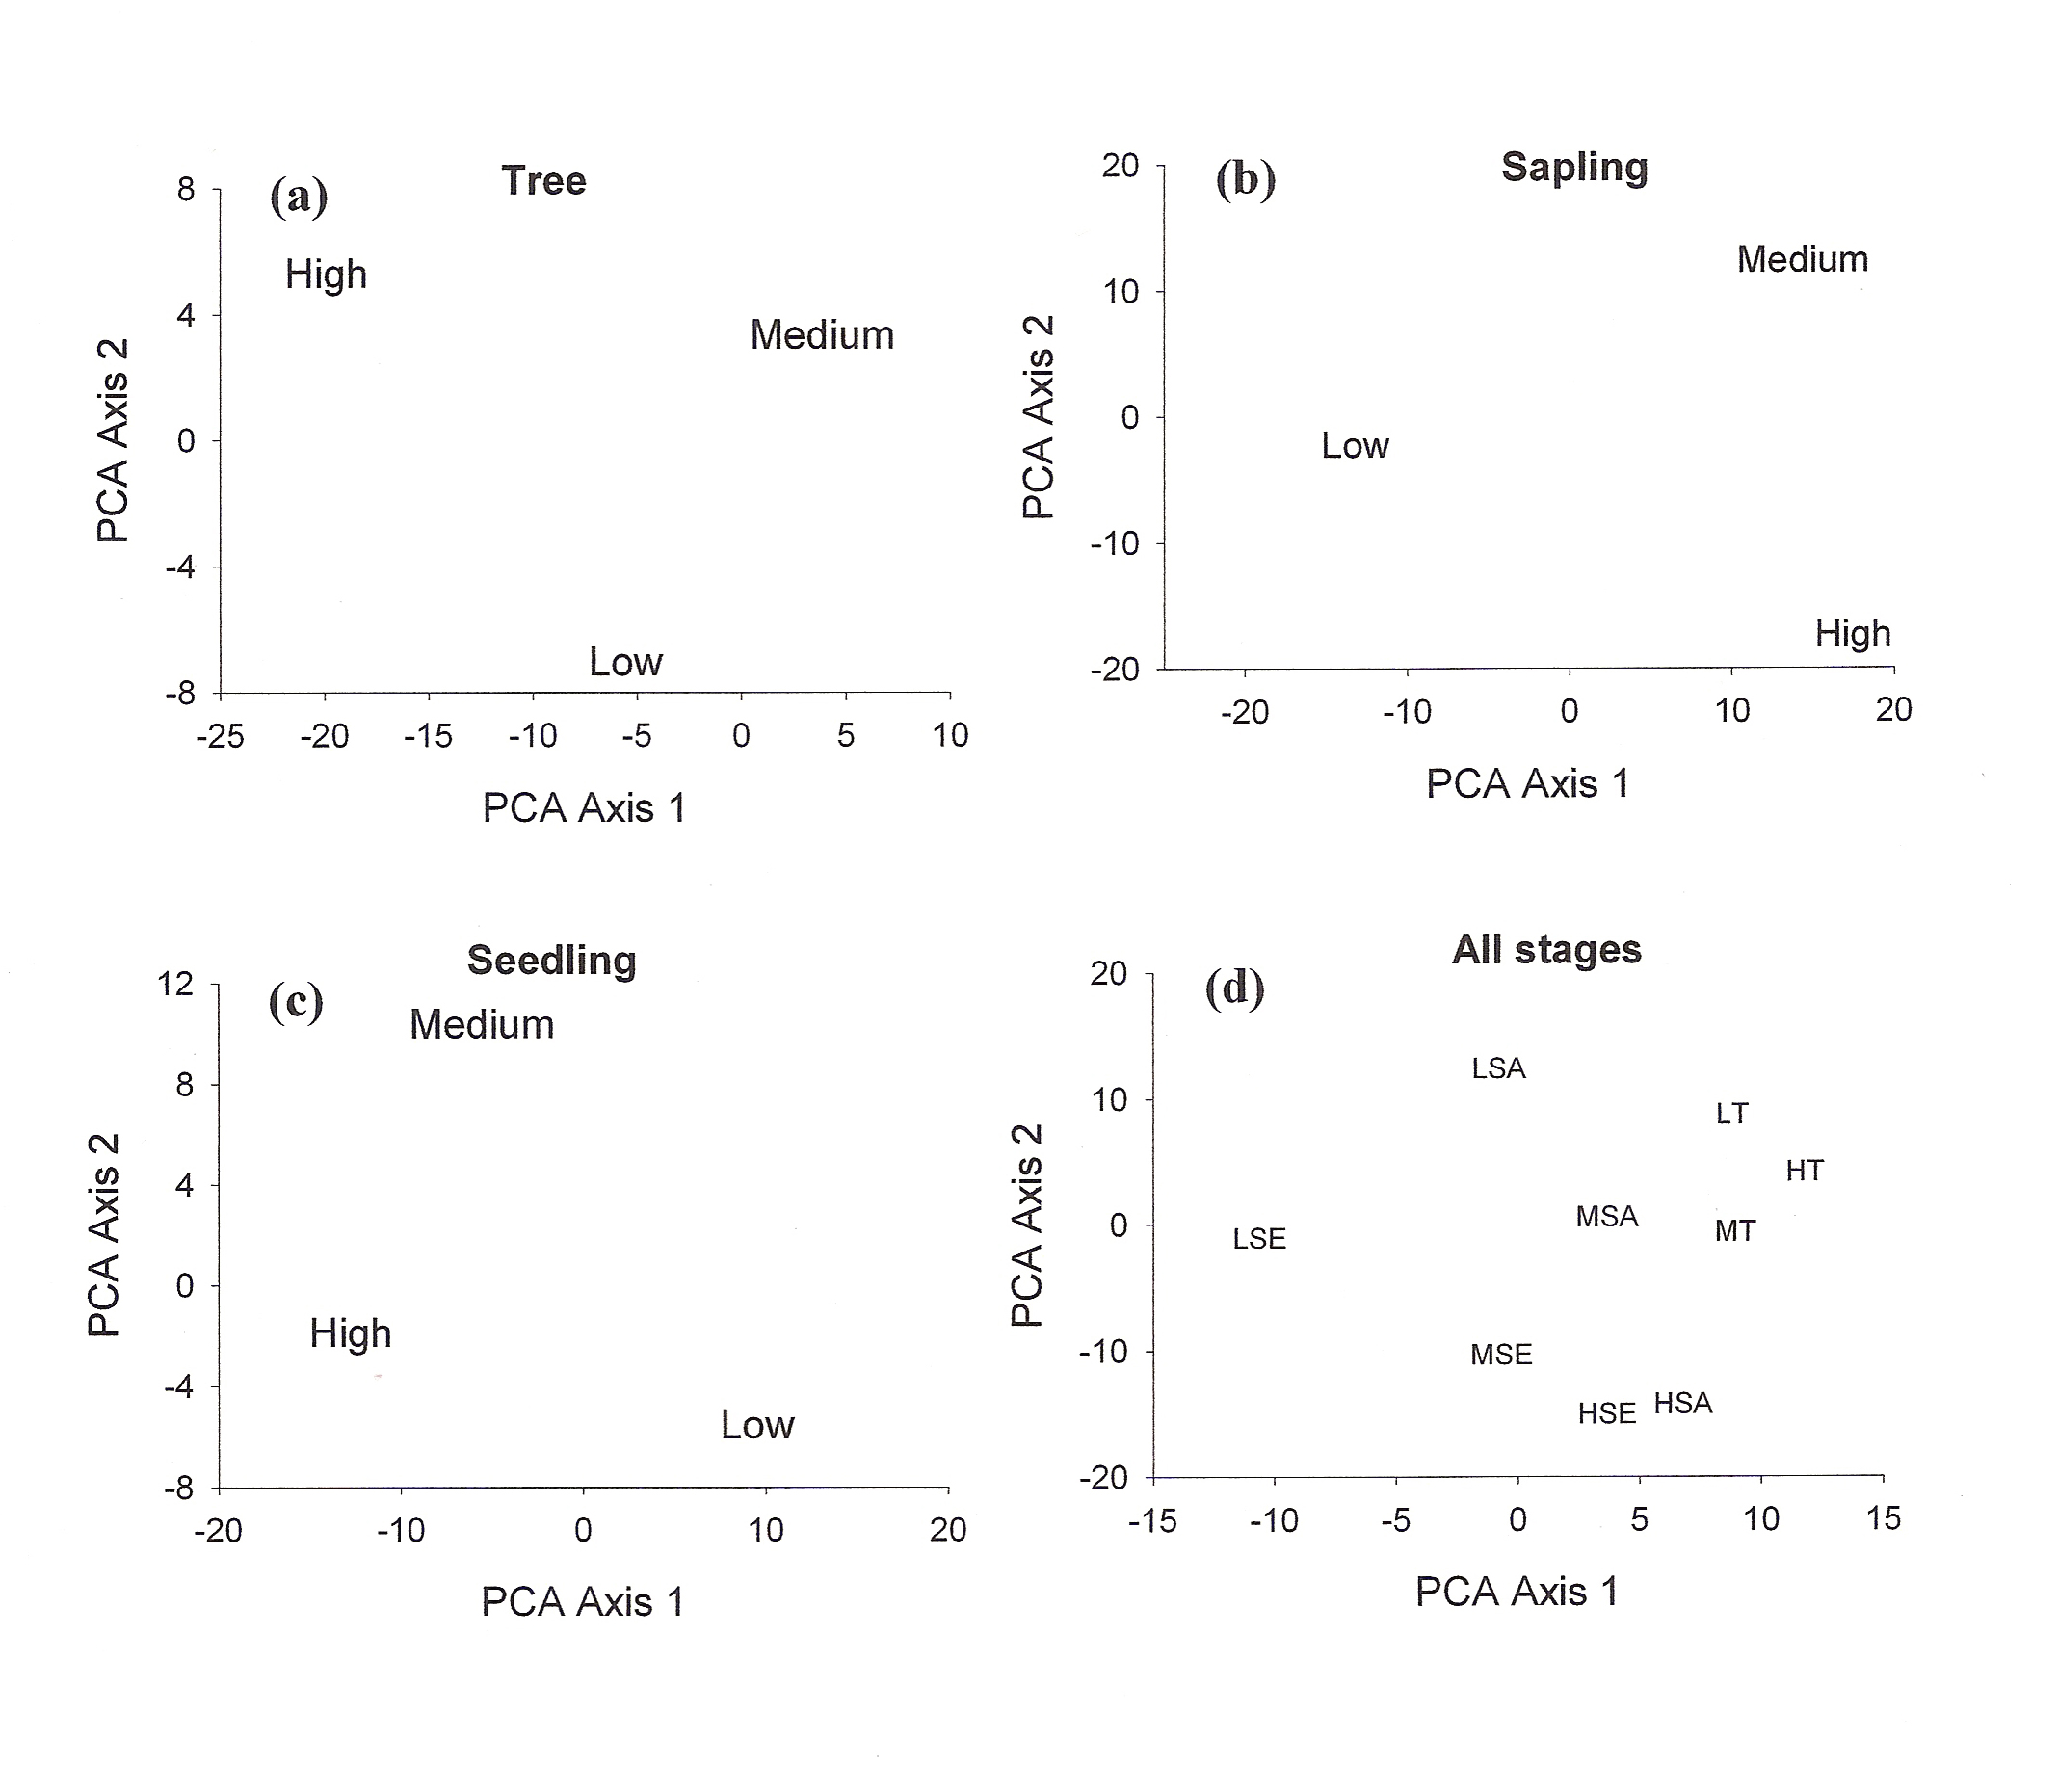
Figure 1: PCA ordination of
lantana invaded {low (L), medium (M) and high (H) } sites (a) for
adult tree species; T (b) for sapling; SA (c) for seedling; SE (d)
all stages taken together.
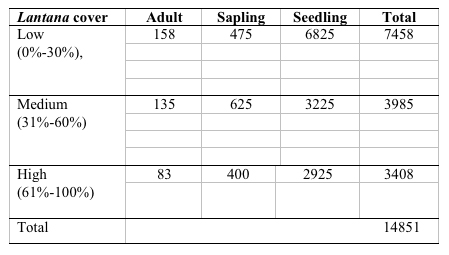
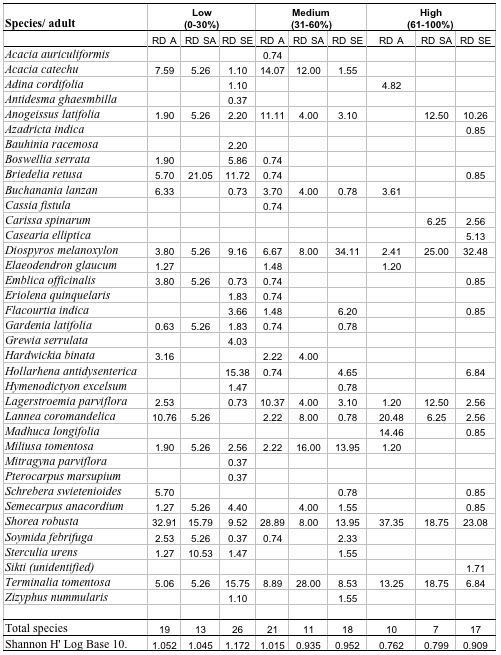
Table 2: Relative density of tree species in different
stages, total species and Shannon diversity at different lantana
cover class. (RDA: Relative density adults, RDSA: Relative density
sapling, RDSE: Relative density seedling)
In the present study, cluster analysis was performed based on relative density of species in their different life cycle stages (tree, sapling and seedling) at low, medium and high lantana cover together, to see the differences in vegetation composition (Fig 2).
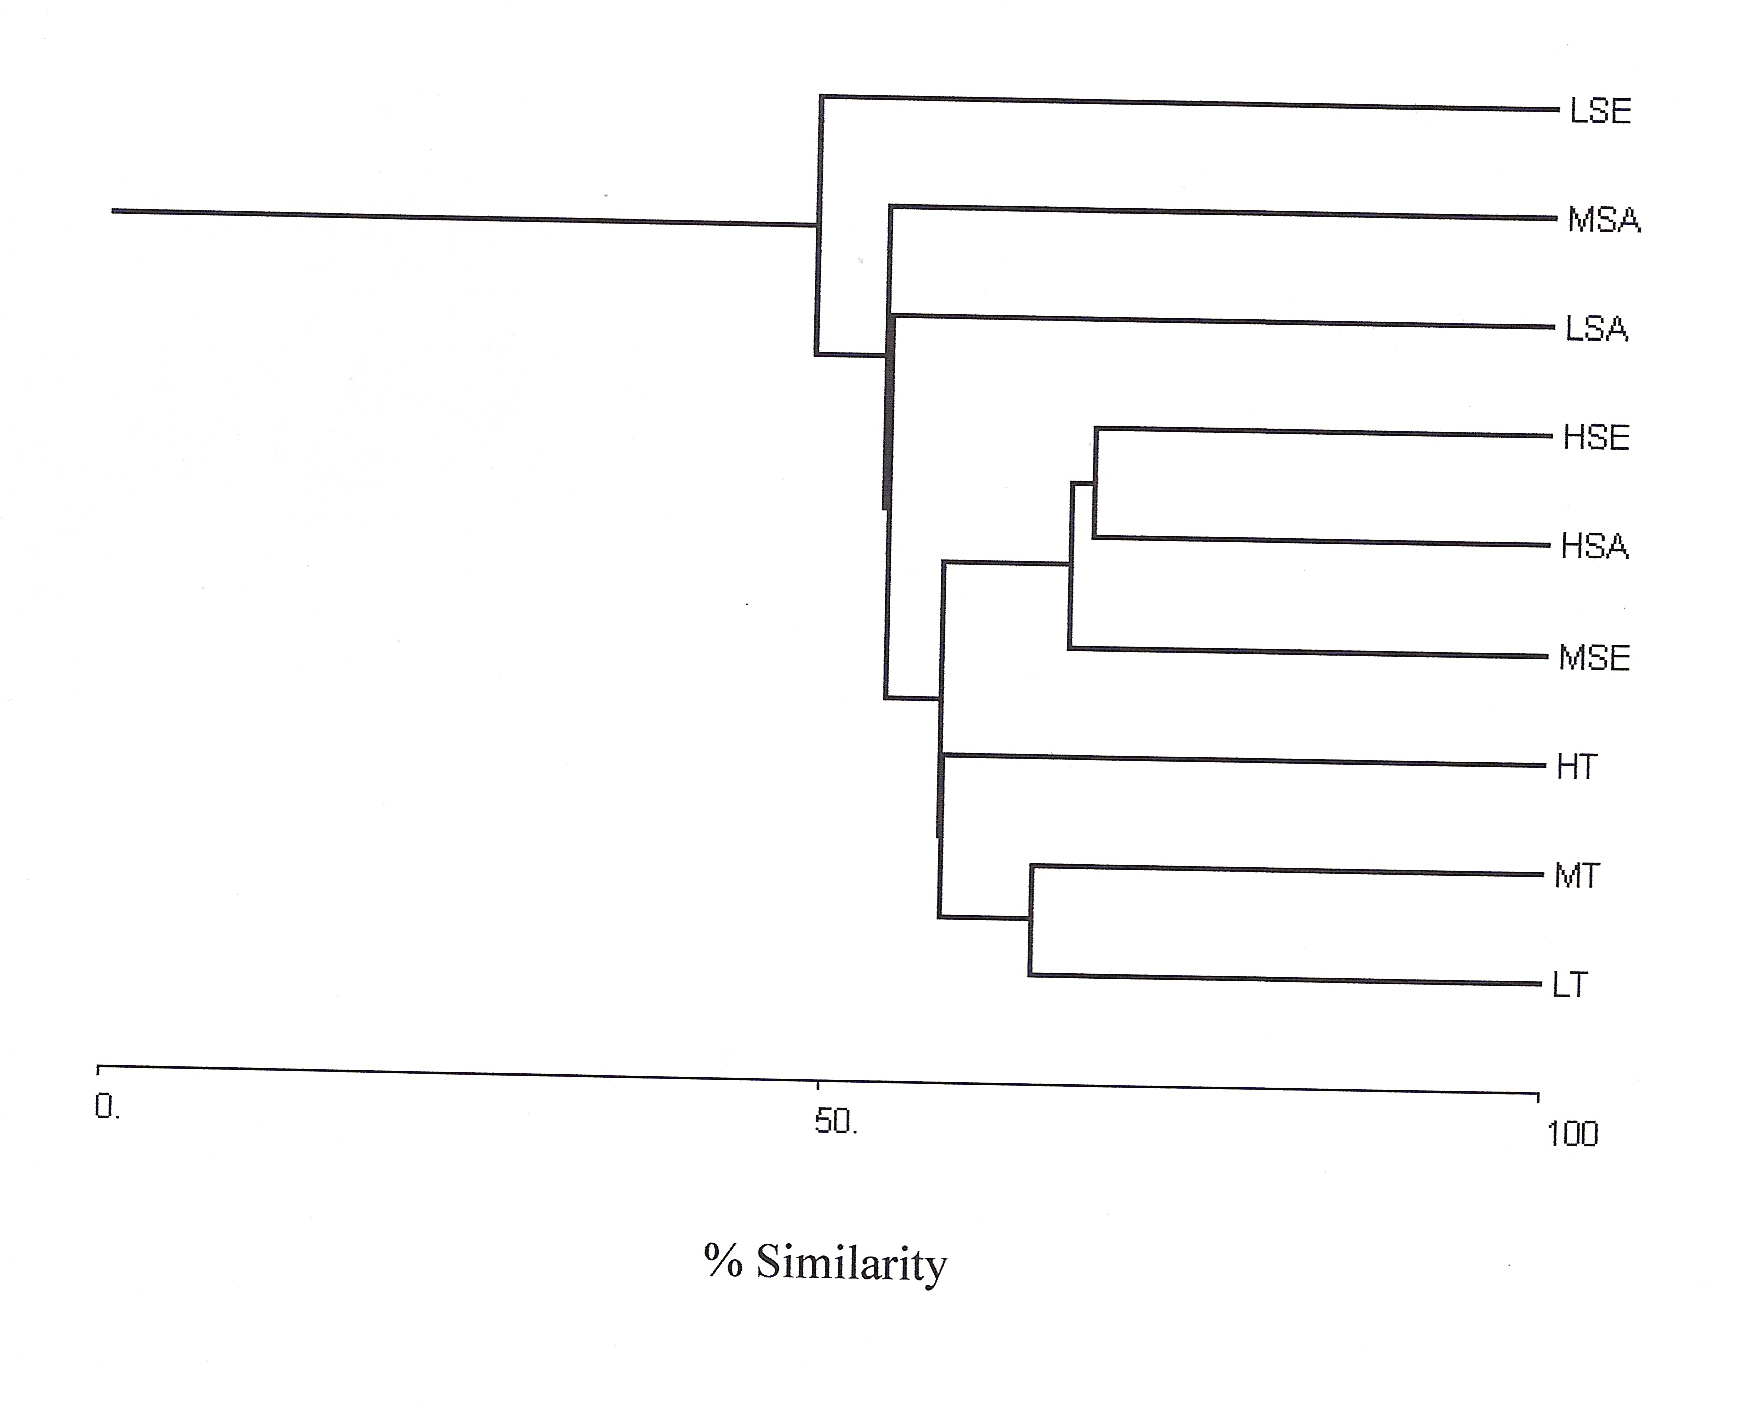
Figure 2: Bray-Curtis Cluster
Analysis (Single link) at low (L), medium (M) and high (H) lantana
cover for tree (T), Sapling (SA) and seedling (SE).
Species diversity
Shannon-Wiener diversity index also decreased with increasing lantana cover. Figure 3 shows K-dominance of species rank plot. The bottom curve (LSE) represented the highest diversity, while the uppermost curve (HSA) represented the lowest diversity. The diversity of different sites was compared using K-dominance plot, in which percentage cumulative importance value is plotted against log species rank (Platt et al 1984). Platt et al (1984) advocated that diversity could only be unambiguously assessed when the K-dominance curves from the sites to be compared do not overlap. In this situation the lowest curve will represent the most diverse site and the upper most curve will represent least diverse site. In the situation where the curves intersect each other, the sites cannot be discriminated among themselves on the basis of life cycle stages. Figure 3 shows that maximum diversity was observed for seedlings at low lantana cover. Seedling and sapling at high lantana cover cannot be distinguished and are least diverse. The species composition pattern observed through both the analysis has shown that the three sites almost similar in tree vegetation composition, revealing that the invader is least affecting the tree composition (Fig 1d and 2). But on the other, seedling composition at the least invaded site differ highly in species composition. Probably as the least invaded site has the highest number of species and also accounted for maximum variation of PCA 1 axis i.e. 44.64%.
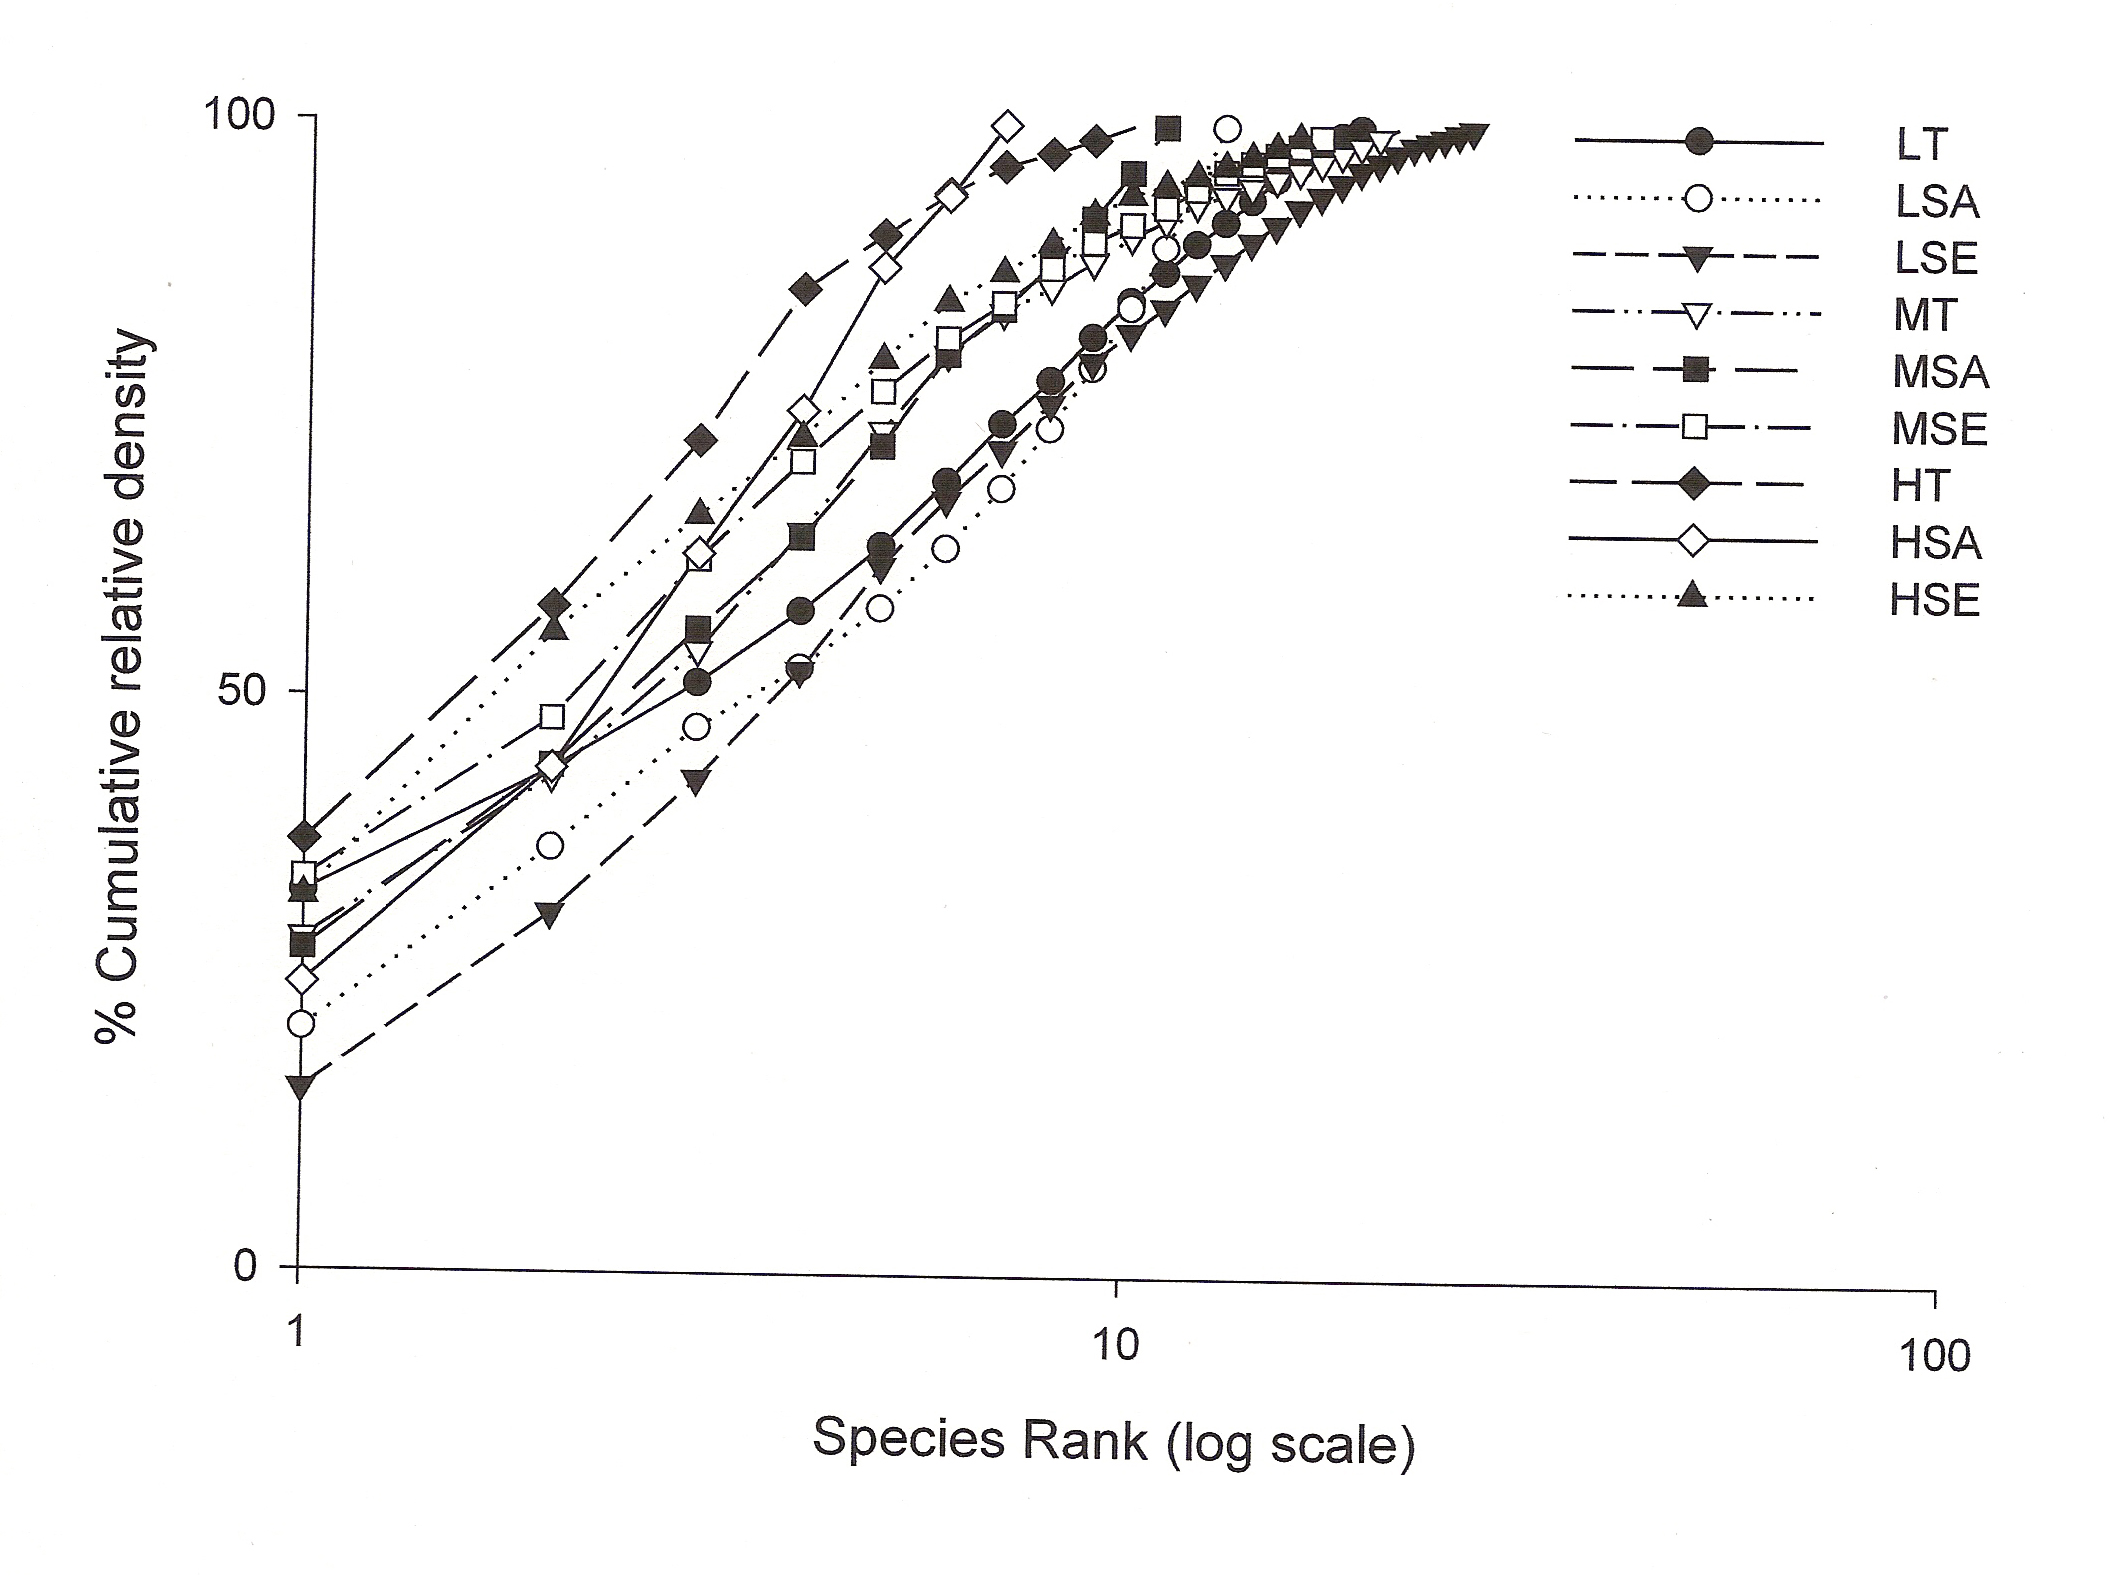
Figure 3: The K-dominance plot
when percent cumulative relative density is plotted against log of
species rank for each class (for abbreviations see fig 2).
Regeneration status
The regeneration potential of the low lantana cover site is better as many new seedlings are emerging (Antidesma ghaesmbilla, Bauhinia racemosa, Eriolena quinquelaris, Flacourtia indica, Grewia serrulata, Hymenodictyon excelsum, Mitragyna parviflora and Pterocarpus marsupium) (Fig 4a:iii). The regeneration potential of the Emblica officinalis, Gardenia latifolia, Lannea coromandelica, Soymida febrifuga and Sterculia urens seems to be well recently but now they seem to disappear (Fig 4a:ii).
The regeneration potential of the medium lantana cover site does not seem to be good as only few seedling species are emerging (Hymenodictyon excelsum, Schrebera swietenioides, Sterculia urens and Zizyphus nummularis) (Fig 4b:iii). The regeneration potential of Acacia catechu, Anogeissus latifolia, Buchanania lanzan, Hardwickia binata, Lannea coromandelica, Miliusa tomentosa and Terminalia tomentosa seemed to be well recently but now they also seem to decline (Fig 4b:ii).
The regeneration of seedlings at high lantana cover site showed only few new species (Anogeissus latifolia, Briedelia retusa, Casearia elliptica, Emblica officinalis, Flacourtia indica, Hollarhena antidysenterica, Schrebera swietenioides, Semecarpus anacardium and Sikti etc (Fig 4c:iii). The regeneration of Lagerstroemia parviflora, Lannea coromandelica, and Terminalia tomentosa seem to be better recently but now it is declining (Fig 4c:ii).
Future composition
In the low lantana invaded forest Shorea robusta will remain as the dominant species but later it may be replaced by Bauhinia racemosa, Diospyros melanoxylon, Hollarhena antidysenterica and Terminalia tomentosa species either (Ref fig 4a).
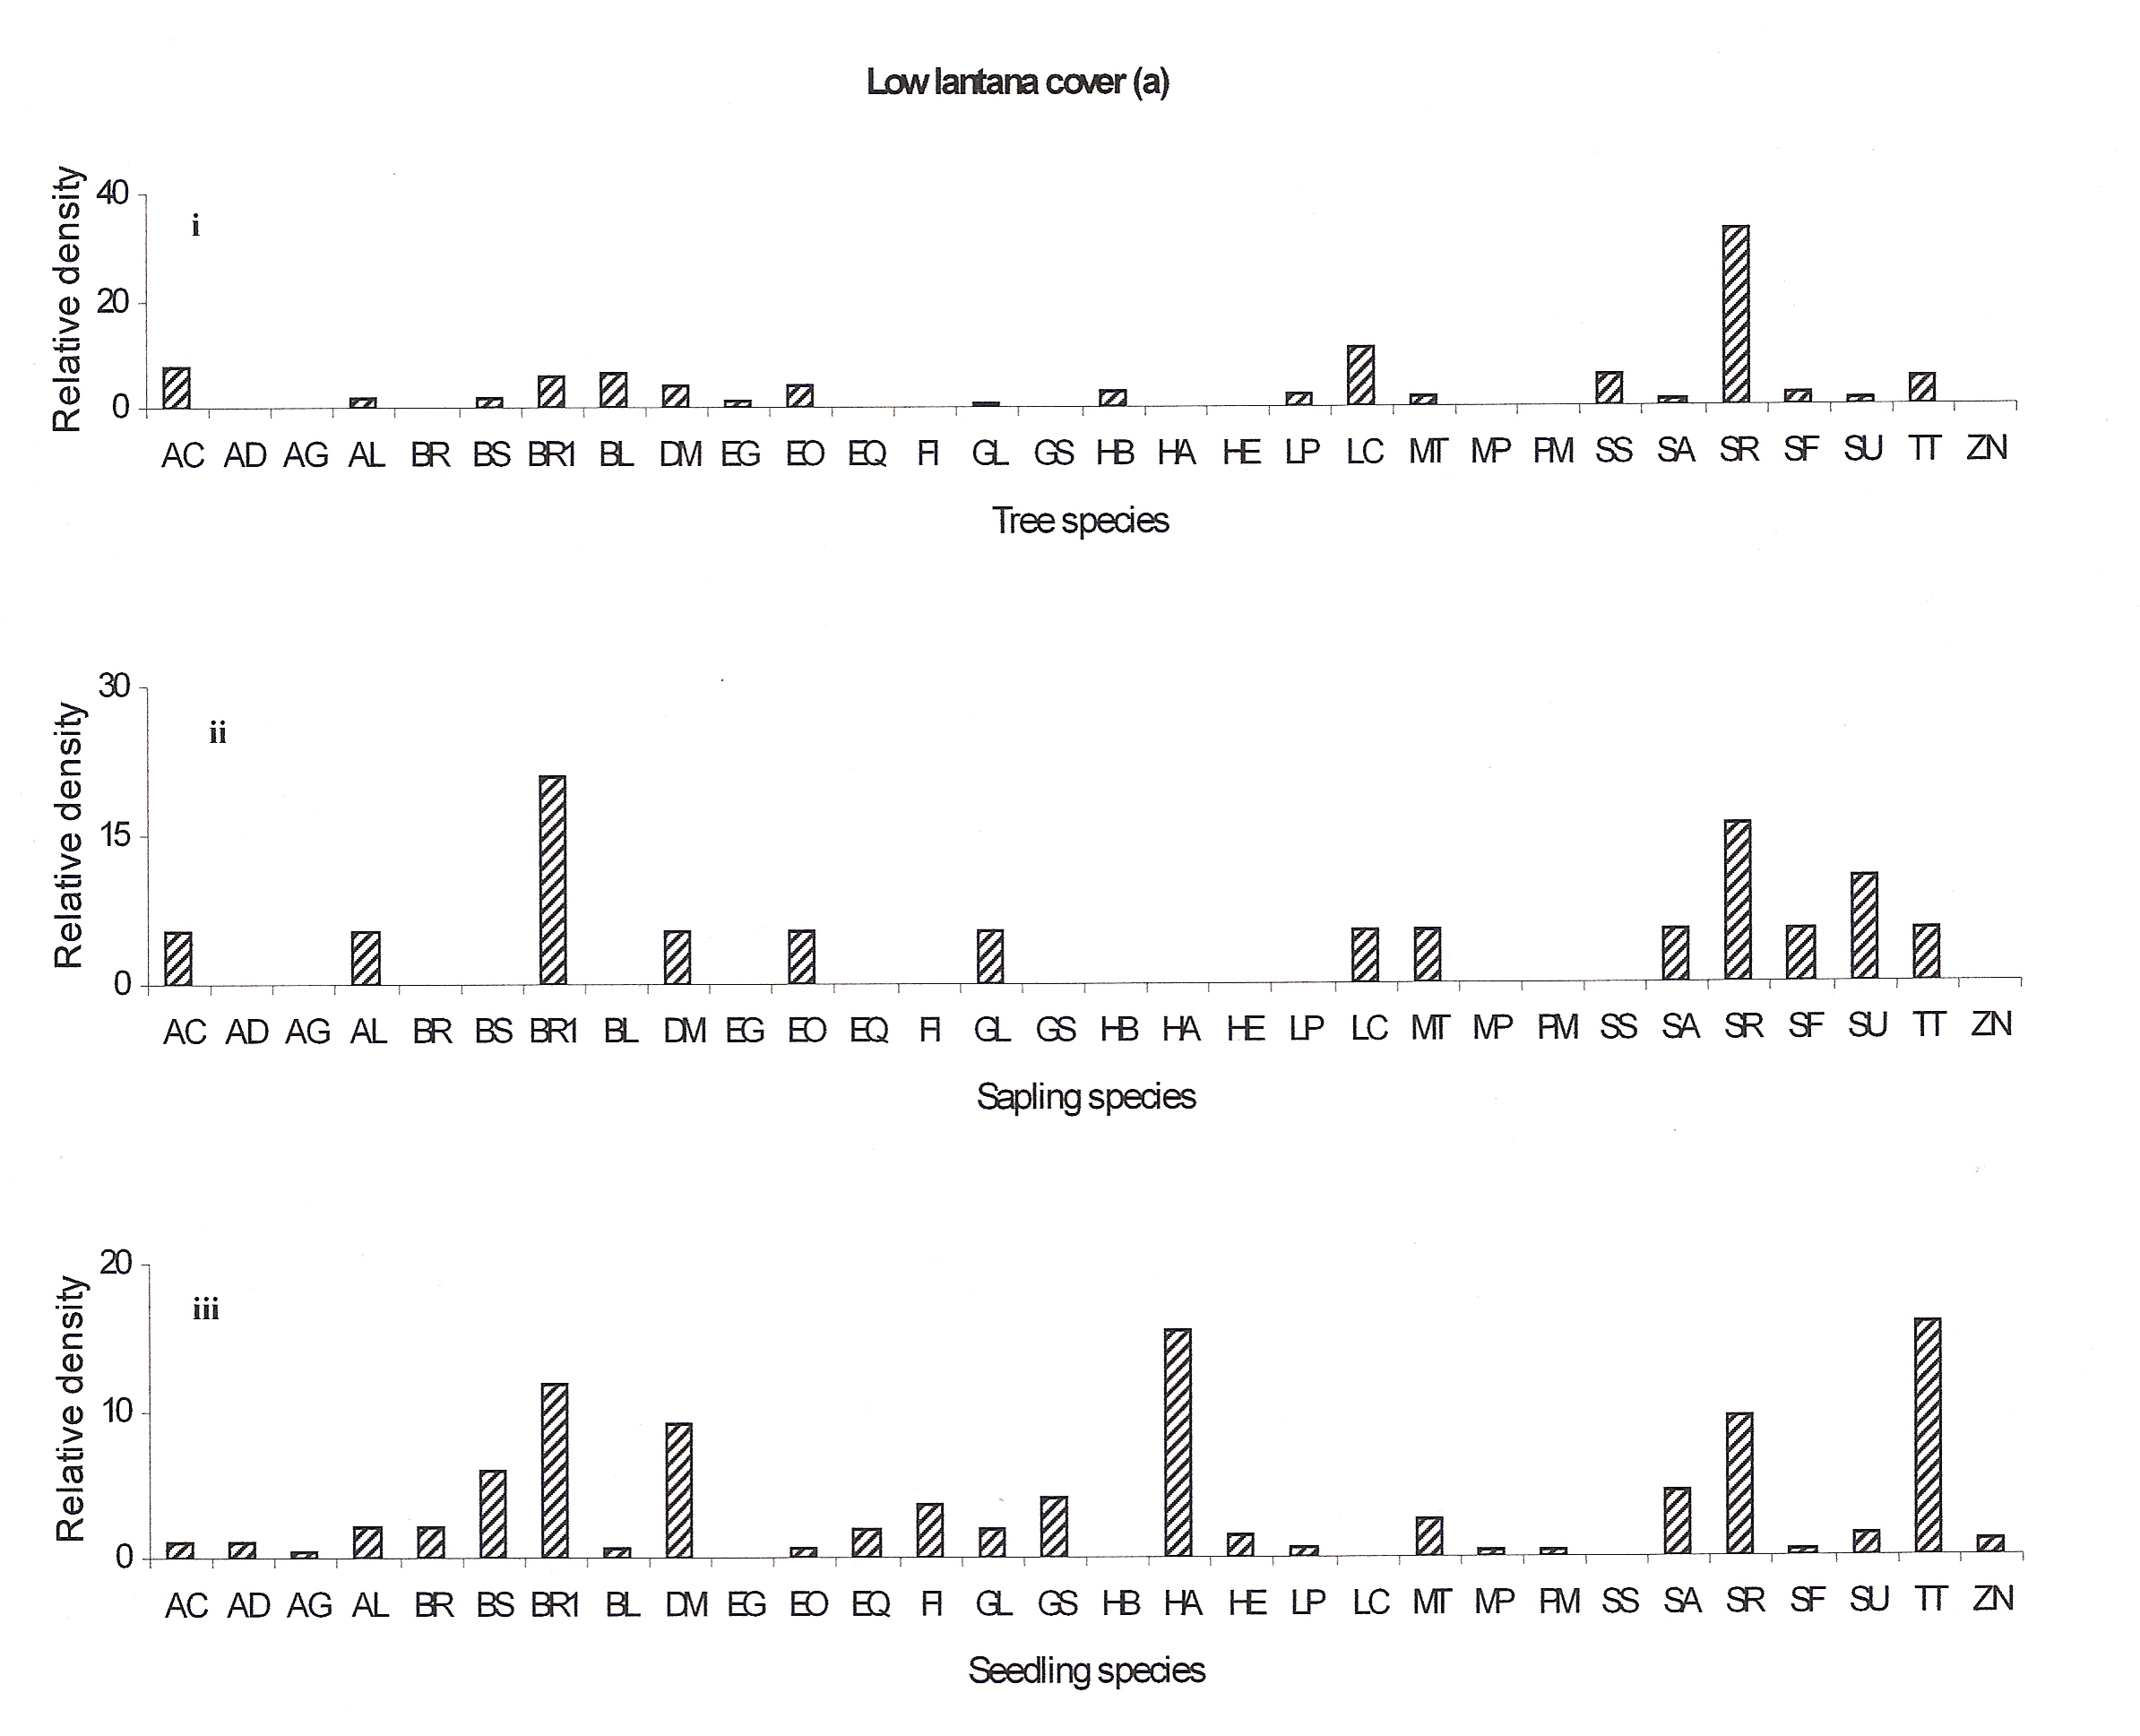
Figure 4a: Relative density of
different species in tree, sapling and seedling stages, at different
lantana cover {low (a), medium (b) and high (c)}. Acacia
auriculiformis =AA, Acacia catechu =AC, Adina
cordifolia =AD, Antidesma ghaesmbilla =AG, Anogeissus
latifolia =AL, Azadricta indica =AI, Bauhinia racemosa
=BR, Boswellia serrata =BS, Briedelia retusa =BR1,
Buchanania lanzan =BL, Cassia fistula =CF, Carissa
spinarum =CS, Casearia elliptica =CE, Diospyros
melanoxylon =DM, Elaeodendron glaucum =EG, Emblica
officinalis =EO, Eriolena quinquelaris =EQ, Flacourtia
indica =FI, Gardenia latifolia =GL, Grewia serrulata
=GS, Hardwickia binata =HB, Hollarhena antidysenterica
=HA, Hymenodictyon excelsum =HE, Lagerstroemia parviflora
=LP, Lannea coromandelica =LC, Madhuca longifolia
=ML, Miliusa tomentosa =MT, Mitragyna parviflora =MP,
Pterocarpus marsupium =PM, Schrebera swietenioides
=SS, Semecarpus anacardium =SA, Shorea robusta =SR,
Soymida febrifuga =SF, Sterculia urens =SU, Sikti
(unidentified) =S, Terminalia tomentosa =TT, Zizyphus
nummularis =ZN.
In the medium lantana invaded forest Shorea robusta may remain as the dominant species but the co-dominant species Acacia catechu may be replaced by Terminalia tomentosa in future. The decline in species at the seedling and sapling stages may be attributed to lantana cover (Ref fig 4b).
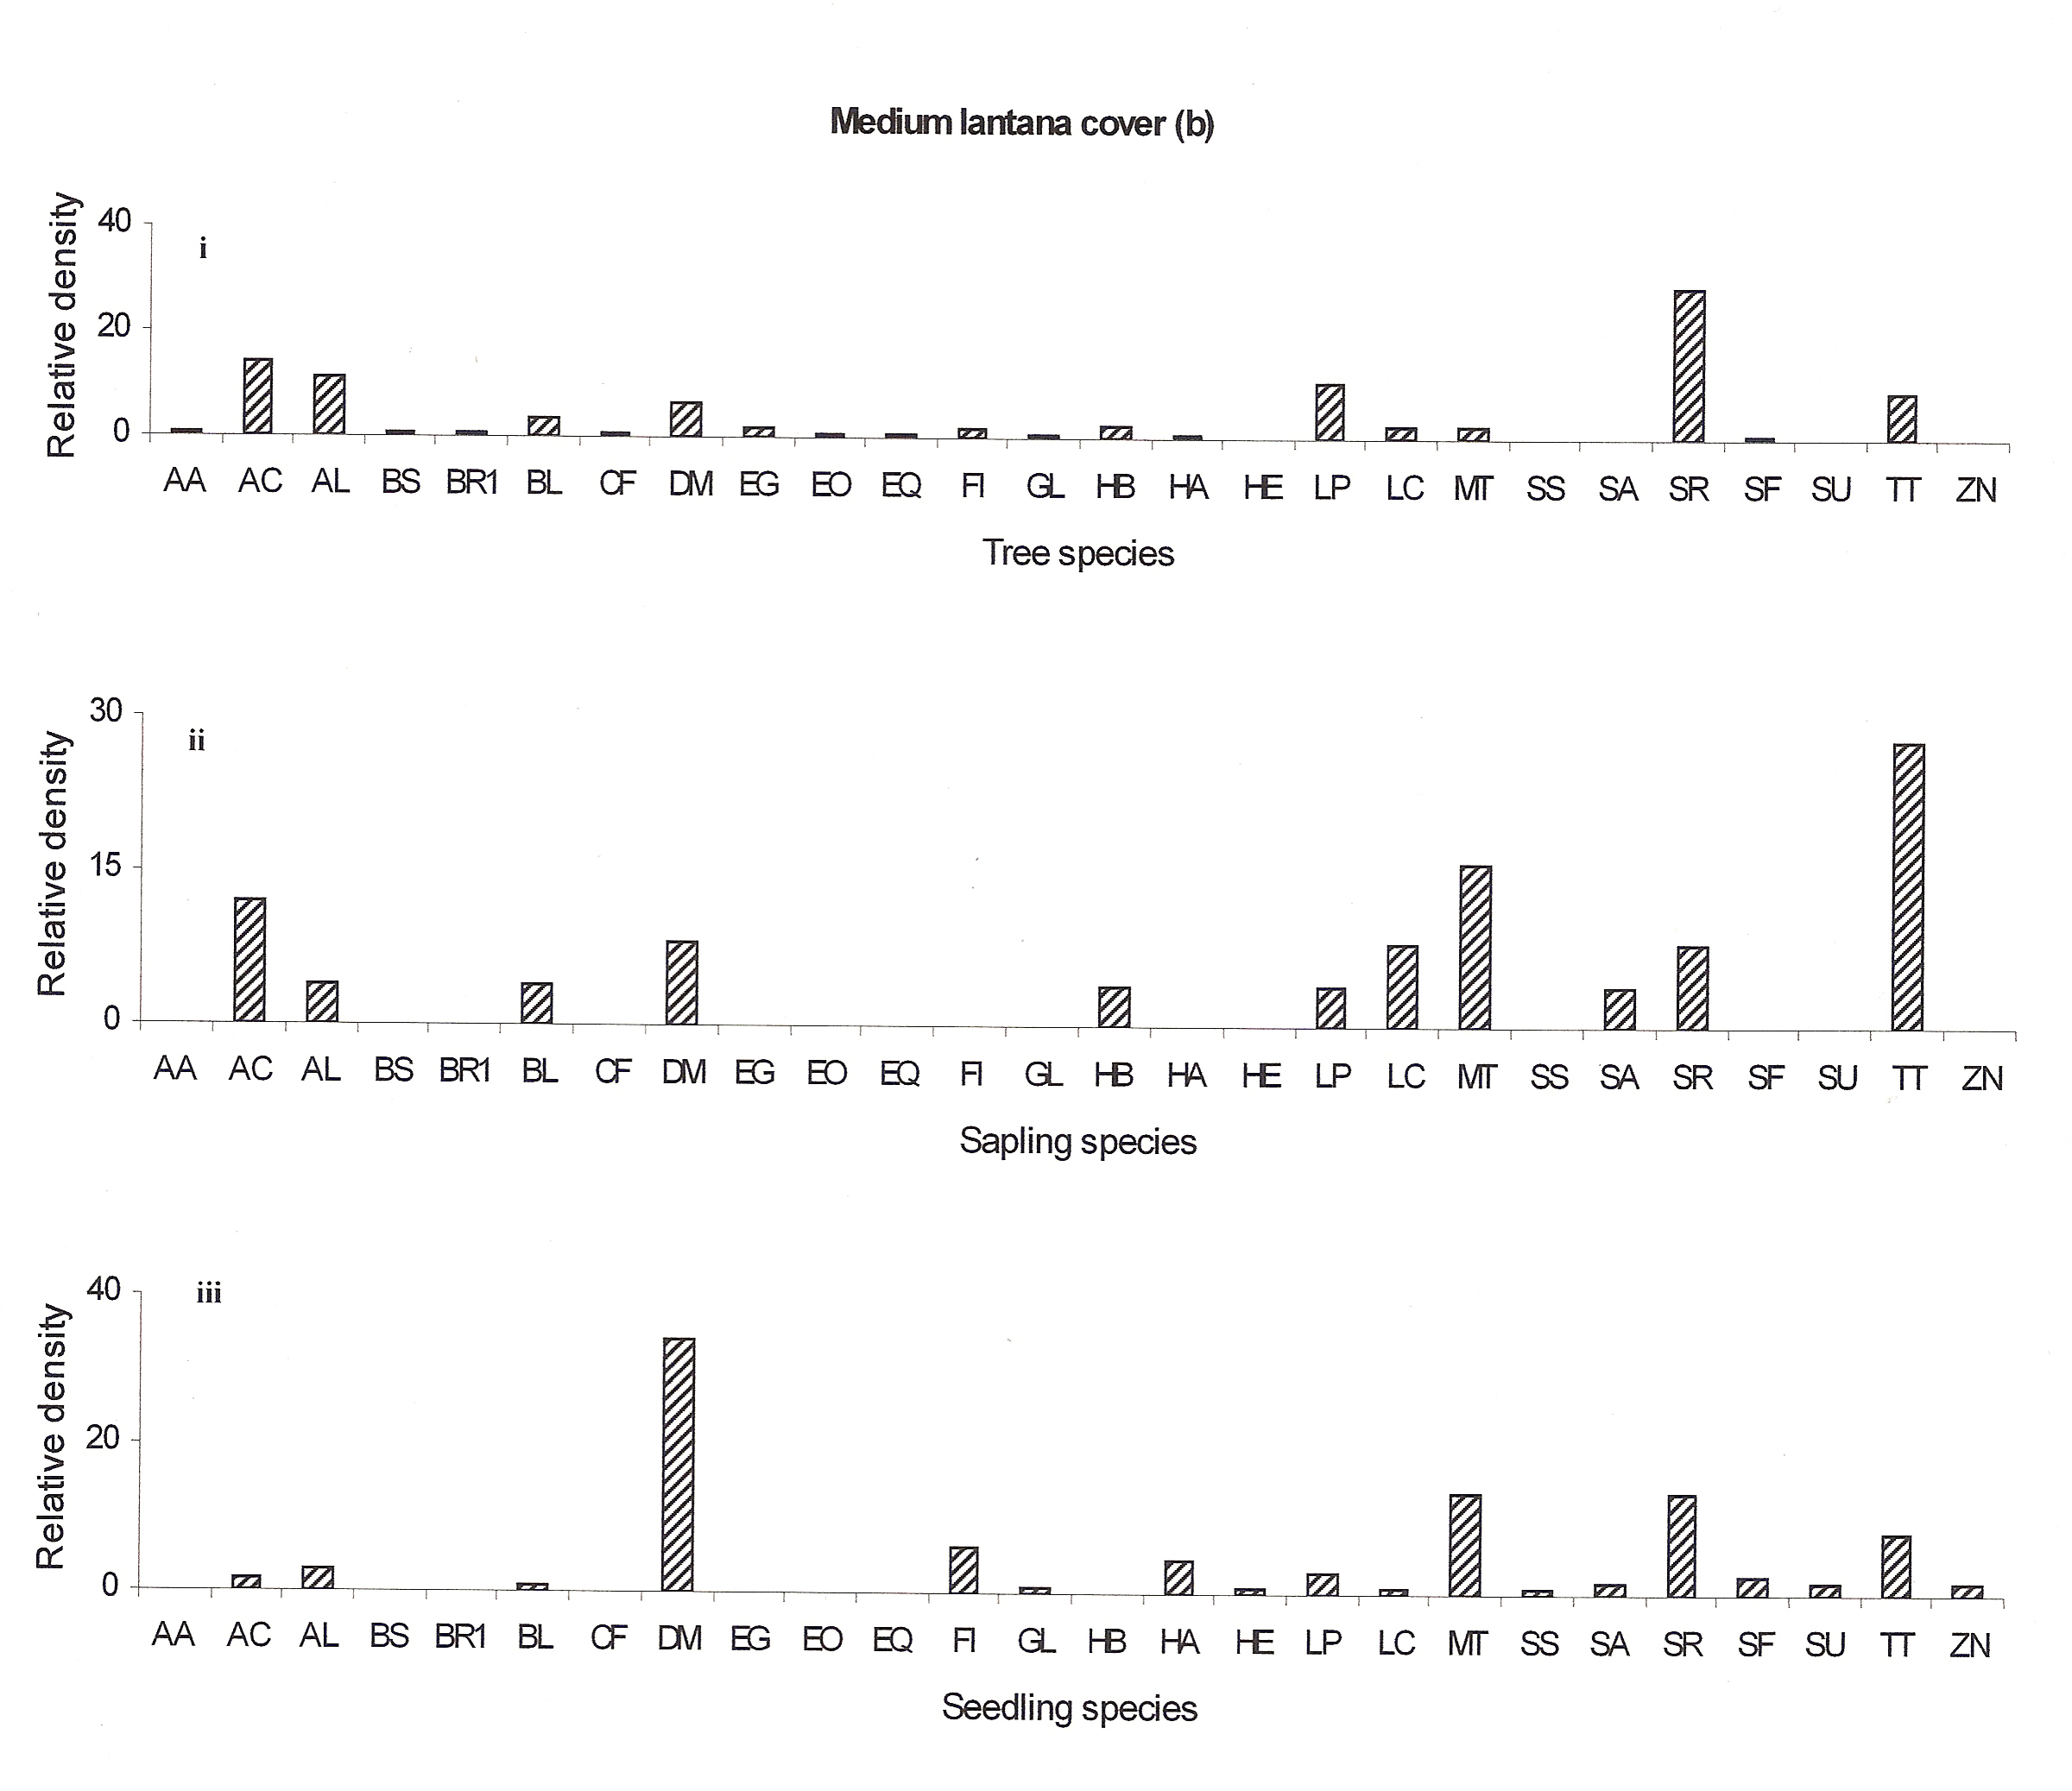
Figure 4b: Relative density of
different species in tree, sapling and seedling stages, at different
lantana cover {low (a), medium (b) and high (c)}. Acacia
auriculiformis =AA, Acacia catechu =AC, Adina
cordifolia =AD, Antidesma ghaesmbilla =AG, Anogeissus
latifolia =AL, Azadricta indica =AI, Bauhinia racemosa
=BR, Boswellia serrata =BS, Briedelia retusa =BR1,
Buchanania lanzan =BL, Cassia fistula =CF, Carissa
spinarum =CS, Casearia elliptica =CE, Diospyros
melanoxylon =DM, Elaeodendron glaucum =EG, Emblica
officinalis =EO, Eriolena quinquelaris =EQ, Flacourtia
indica =FI, Gardenia latifolia =GL, Grewia serrulata
=GS, Hardwickia binata =HB, Hollarhena antidysenterica
=HA, Hymenodictyon excelsum =HE, Lagerstroemia parviflora
=LP, Lannea coromandelica =LC, Madhuca longifolia
=ML, Miliusa tomentosa =MT, Mitragyna parviflora =MP,
Pterocarpus marsupium =PM, Schrebera swietenioides
=SS, Semecarpus anacardium =SA, Shorea robusta =SR,
Soymida febrifuga =SF, Sterculia urens =SU, Sikti
(unidentified) =S, Terminalia tomentosa =TT, Zizyphus
nummularis =ZN.
At highly invaded lantana sites Shorea robusta may remain as the dominant species in the future but the co-dominant species Diospyros melanoxylon, Terminalia tomentosa, Anogeissus latifolia and Lagerstroemia parviflora may replace Lannea coromandelica (Ref fig 4c). The decline of Diospyros melanoxylon at the tree stage may be attributed to its heavy exploitation. According to Spurr and Barnes (1980) heavy exploitation of a single species can cause the entire structure of the community to change. But here at the high-invaded site lantana cover could be responsible for forest compositional change.
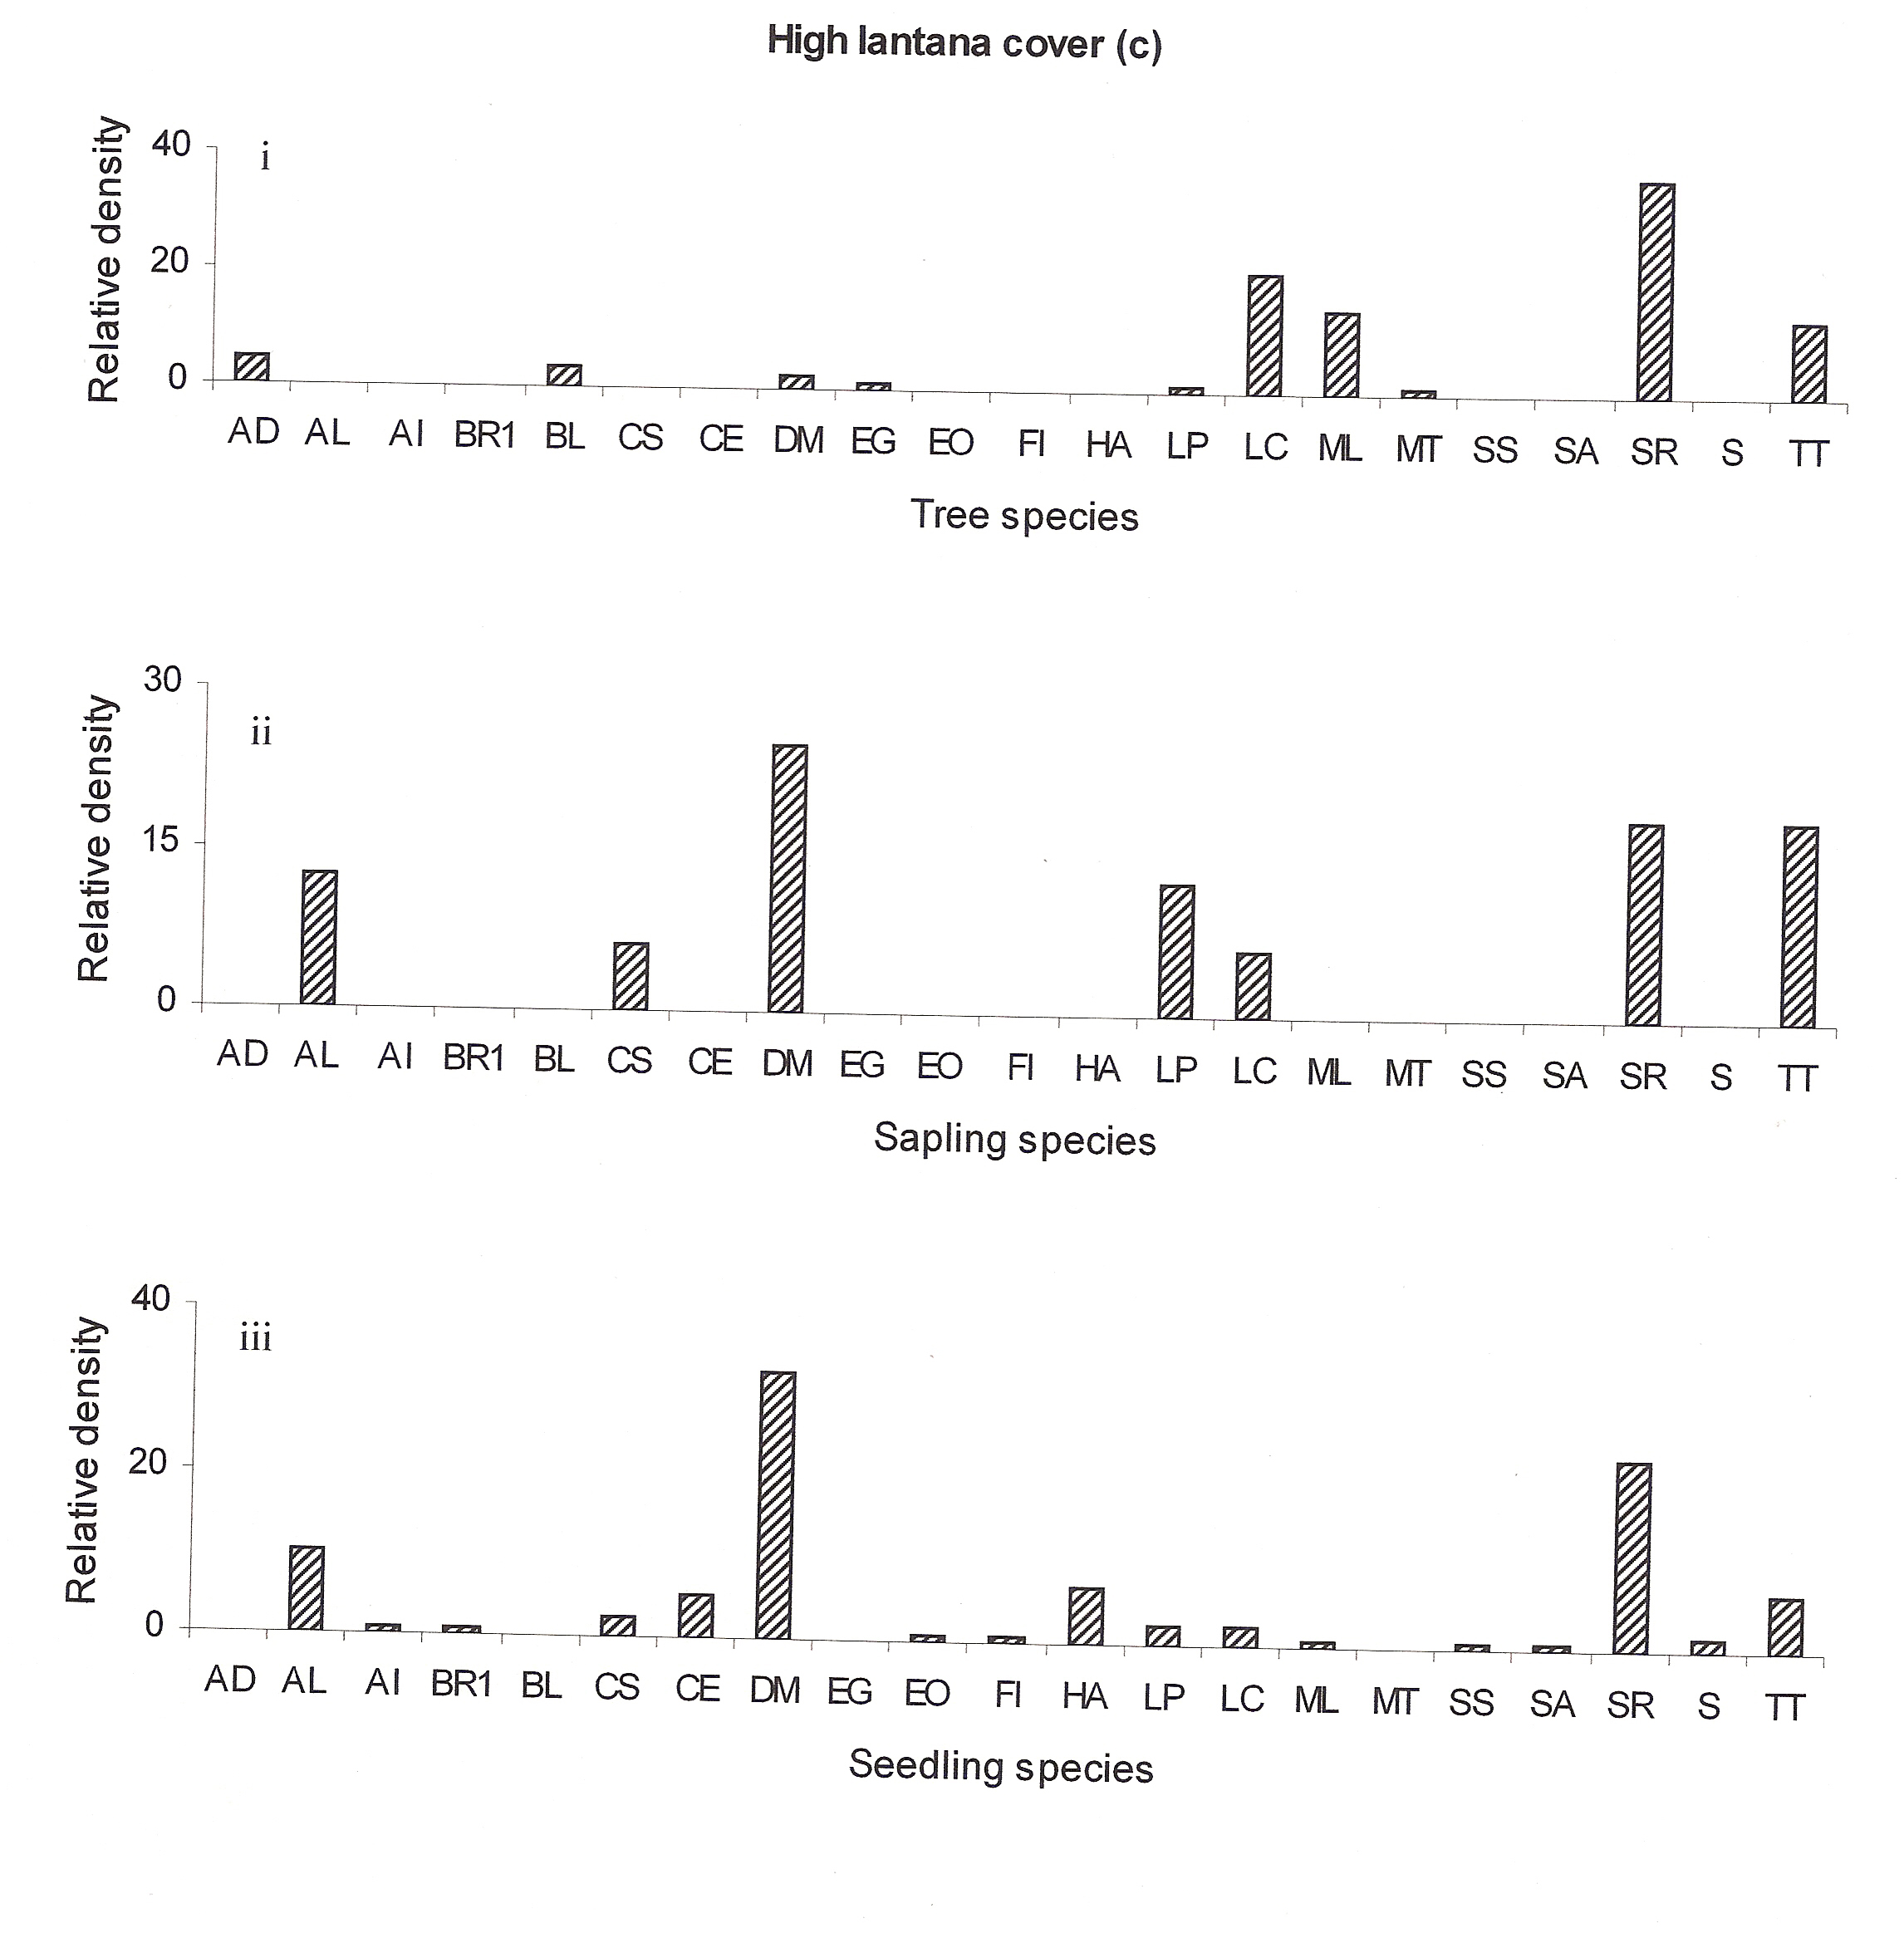
Figure 4c: Relative density of
different species in tree, sapling and seedling stages, at different
lantana cover {low (a), medium (b) and high (c)}. Acacia
auriculiformis =AA, Acacia catechu =AC, Adina
cordifolia =AD, Antidesma ghaesmbilla =AG, Anogeissus
latifolia =AL, Azadricta indica =AI, Bauhinia racemosa
=BR, Boswellia serrata =BS, Briedelia retusa =BR1,
Buchanania lanzan =BL, Cassia fistula =CF, Carissa
spinarum =CS, Casearia elliptica =CE, Diospyros
melanoxylon =DM, Elaeodendron glaucum =EG, Emblica
officinalis =EO, Eriolena quinquelaris =EQ, Flacourtia
indica =FI, Gardenia latifolia =GL, Grewia serrulata
=GS, Hardwickia binata =HB, Hollarhena antidysenterica
=HA, Hymenodictyon excelsum =HE, Lagerstroemia parviflora
=LP, Lannea coromandelica =LC, Madhuca longifolia
=ML, Miliusa tomentosa =MT, Mitragyna parviflora =MP,
Pterocarpus marsupium =PM, Schrebera swietenioides
=SS, Semecarpus anacardium =SA, Shorea robusta =SR,
Soymida febrifuga =SF, Sterculia urens =SU, Sikti
(unidentified) =S, Terminalia tomentosa =TT, Zizyphus
nummularis =ZN.
Lantana cover and mortality
The differential response of species at different lantana cover may be attributed to differed fire, light and allelopathic interaction within the community.
Fire
Although lantana burns readily during hot, dry conditions, even when green (Gujral & Vasudevan, 1983), moderate and low intensity fire may promote the persistence and spread of lantana thickets rather reducing them. However, on the other, such conditions increase seedling mortality of tree species. As the depth of heat penetration can be expected to affect regeneration of buried propagules and young seedlings (Moore and Wein 1977). Further, lantana invasion promotes fire due to its self-perpetuating fire cycle (Hiremath and Sundaram, 2005), which may ultimately culminate into mortality of seedlings.
Light
Light limitation is the mechanism by which undisturbed vegetation limits the invasion of lantana. Light has long been recognized as an important plant resource (Maximov 1929; Blankenship 2002) that may interact with other plant resources to affect plant performance (Cole 2003). Below certain thresholds, however, light limitation alone can prevent seedling survival regardless of other resource levels (Tilman 1982). It is likely that shrubs influence the distribution and abundance of tree species seedling by reducing the amount of light that reaches the forest floor, and this is probably the mechanism responsible for the decline in tree seedlings beneath lantana canopies (Gyan P Sharma pers. obs.). However, the dense cover created by vertical stratification of lantana may reduce the intensity or duration of light and thus prevent the establishment of other tree species seedlings. Low light has been shown to affect the distribution of other herbaceous species in understory habitats (Sharma et al. 2005), and this may have important management implications for biological invasions and maintenance of biological diversity.
Allelopathy
Lantana due to its strong allelopathic properties has the potential to interrupt regeneration process of other species by decreasing germination, reducing early growth rates and selectively increasing mortality of other plant species. These result in a reduction of seedling diversity (Loyn and French 1991; Gentle and Duggin 1998). Subsequently results in marked changes in the structural and floristic composition of natural communities. Therefore, as the density of lantana in forests increases, species richness decreases (Fensham et al., 1994), which is consistent with the findings reported here. In most cases, the native species outperformed the alien under conditions of reduced light (Daehler, 2003), increased fire and allelopathy.
In conclusion we may say that lantana suppress the regeneration of other vegetation. Thus in the near future it will reduce the availability of forest products that people derive from the forest. This is a serious concern for biodiversity conservation and human society.
Acknowledgements
Funding support
from Department of Science and Technology, and from Council of
Scientific and Industrial Research, New Delhi, in form of a JRF to
GPS is gratefully acknowledged.
References
Aldenderfer, M.S. & R.K. Blashfield. 1984. Cluster Analysis, Sage, London, 88 p.
Anonymous, 2003. District of India. Retrieved from www.statoids.com/yin.html on 14 June 2005.
Backer, E. 1994. Computer-assisted Reasoning in Cluster Analysis, Pearson Education, 300 p.
Blankenship, R.E. 2002. Molecular Mechanisms of Photosynthesis. Blackwell Science, Oxford
Cole, P.G. 2003. Environmental constraints on the distribution of the non-native invasive grass, Microstegium vimineum. PhD Thesis, Department of Ecology and Evolutionary Biology, University of Tennessee, Knoxville, TN.
Daehler, C.C. 2003. Performance comparison of co-occurring native and alien invasive plants: implication for conservation and restoration. Ann. Rev. Ecol. Syst. 34, 183-211.
Fensham, R.J., R.J. Fairfax & R.J. Cannell. 1994. The invasion of Lantana camara L. in Forty Mile Scrub National Park, North Queensland. Austr. J. Ecol. 19, 297-305.
Duggin J.A. & C.B. Gentle. 1998. Experimental evidence on the importance of disturbance intensity for invasion of Lantana camara L. in dry rainforest-open forest ecotones in north-eastern NSW, Australia. Forest Ecol. Manag. 109, 279-292.
Gujral, G.S. & P. Vasudevan. 1983. Lantana camara L., a problem weed. J. Sci. Indust. Res. 42, 281-286.
Hiremath, A. & B. Sundaram. 2005. The fire- Lantana cycle hypothesis in Indian forests. Conserv. Soc. 3(1), 26-42.
Hobbs, R.J., 2000. Land-use changes and invasions. In: Mooney, H.A. & R.J. Hobbs, (Eds.), Invasive Species in a Changing World. Island Press, Covelo, pp. 55-64.
Jha, C. S. & J.S. Singh,. 1990. Composition and dynamics of dry tropical forests in relation to soil texture. J. Veg. Sci. 1, 609-614.
Loyn, R.H. & K. French. 1991. Birds & environmental weeds in south-eastern Australia. Pl. Prot. Quart. 6, 137-149.
Mack, R.N., D. Simberloff, W.M. Lonsdale et al. 2000. Biotic invasions: causes, epidemology, global consequences and control. Ecol. Appl. 10, 689-710.
Marshall, S. & M. Elliott. 1998, Environmental influences on the fish assemblage of the Humber estuary, U.K. Estuar. Coast. Shelf Sci. 46, 175-184.
Maximov, N.A. 1929. The Plant in Relation to Water. George Allen & Unwin, London
Mc Aleece, 1997. Biodiversity Pro. www.sams.ac.uk/dml/projects/benthic/bdpro.
Mo, E.F. 1999. National Policy and Macrolevel Action Strategy on Biodiversity. Ministry of Environment & Forests, Government of India, New Delhi. India.
Moore, J.M. & R.W. Wein. 1977. Viable seed population by soil depth and potential site recolonization after disturbance. Can. J. Bot. 55, 2408-2412.
Mueller-Dumbois, D. & H. Ellenberg. 1974. Aims and methods of vegetation ecology. John Wiley & Sons, New York.
Platt, H.M., K.M. Shaw & P.J.D. Lambshead. 1984. Nematode species abundance patterns and their use in the detection of environmental perturbations. Hydrobiologia 118, 59-66.
Raghubanshi, A.S. 1992. Effect of topography on selected soil properties and nitrogen mineralization in a dry tropical forest. Soil Biol. Biochem. 24, 145-150.
Rajya N.S. 2000. Sankhyikiya Patrika: Janpad Sonbhadra. Karyalaya Arth aunm Sankhya Prabhag, Rajya Niyojan Sansthan, Uttar Pradesh, India. Sagar and Singh 2004
Shannon, C.E. & W. Weaver. 1949. The mathematical theory of communication. University of Illinois Press, Urbana, Illinois.
Sharma, G.P. & A. Raghubanshi. S. 2005. Impact of Lantana camara L. invasion on herb layer diversity and soil properties in a dry deciduous forest. (In press).
Singh, V.P. & J.S. Singh. 1989. Man and forest: a case study from the dry tropics of India. Environ. Conserv. 16, 129-136.
Singh, K.P. & J.S. Singh. 1988. Certain structural and functional aspects of dry tropical forests and savanna. Internat. J. Ecol. Environ. Sci. 14, 31-45.
Singh, A.K., A.S. Raghubanshi & J.S. Singh. 2002. Medical ethnobotany of the tribals of Sonaghati of Sonebhadra district, Uttar pradesh, India. J. Ethnopharmacology 81, 31-41.
Singh, J.S. & V.K. Singh. 1992. Phenology of seasonally dry tropical forest. Curr. Sci. 63, 684-688.
Sagar, R. & J.S. Singh. 2004. Local plant species depletion in a tropical dry deciduous forest of northern India. Envir. Conserv. 31, 55-62.
Spurr, S.H. & B.V. Barnes. 1980. Forest Ecology. New York, John Wiley.
Tilman, D. 1982. Resource Competition and Community Structure. Princeton University Press, NJ